 |
The first chart is copied from Gunfree, whose purpose is expressed well enough by their name. The numbers speak for themselves. So far as I've been able to tell, the numbers are accurate. They do not, however, give an accurate picture.
|
|
|
|
|
|
||||
|
Rate |
Number |
Rate |
Number |
Rate |
Number |
Rate |
Number |
|
|
United States |
13.7 |
35,957 |
6.0 |
15,835 |
7.0 |
18,503 |
0.5 |
1,225 |
|
Australia |
3.05 |
536 |
0.56 |
96 |
2.38 |
420 |
0.11 |
20 |
|
Canada |
4.08 |
1,189 |
0.6 |
176 |
3.35 |
975 |
0.13 |
38 |
|
Germany |
1.47 |
1,197 |
0.21 |
168 |
1.23 |
1,004 |
0.03 |
25 |
|
Japan |
0.07 |
93 |
0.03 |
34 |
0.04 |
49 |
0.01 |
10 |
|
Sweden |
2.31 |
200 |
0.31 |
27 |
1.95 |
169 |
0.05 |
4 |
|
Spain |
1.01 |
396 |
0.19 |
76 |
0.55 |
219 |
0.26 |
101 |
|
United Kingdom |
0.57 |
277 |
0.13 |
72 |
0.33 |
193 |
0.02 |
12 |
|
Vietnam |
0.18 |
131 |
0.12 |
85 |
0.02 |
16 |
0.04 |
30 |
They choose to report firearm homicide and suicide data alone, rather than total homicides and suicides. The Second Amendment thesis is that the ability to defend one's self deters crime. Banning guns does cause murders and suicides to switch weapons, but does it save lives? Thus, looking at the overall rates rather than firearm rates is the relevant measure of how well a people is protected. Looking at suicide rates, rather than gun suicide rates, measures how many die.
|
|
Rate |
Suicide |
Accident |
Rate |
Risk |
Homicide |
|
|
|
|
|
|
|
|
|
|
|
|
|
|
|
|
|
|
|
|
|
|
|
|
|
|
|
|
|
|
|
|
|
|
|
|
|
|
|
|
|
|
|
|
|
|
|
|
|
|
|
|
|
|
|
|
|
|
|
|
|
|
|
|
|
|
|
|
|
|
|
|
|
|
|
|
|
|
|
|
|
|
|
|
|
|
|
|
|
|
|
|
|
|
|
|
|
|
|
|
|
|
|
|
|
|
|
|
|
|
|
|
|
|
|
|
|
|
|
|
|
|
|
|
|
|
|
|
|
|
|
|
|
|
|
|
|
|
|
|
|
|
|
|
The above chart includes all of Gunfree's countries, plus a Europe heavy selection of others. The years vary. These are the most recent numbers found in a sincere but not exhaustive web search. The US homicide number is from 1998. The rest of the numbers are from the UN report, primarily between 1994 and 1996. The dashes indicate numbers that were not reported to the UN. The chart is sorted by total deaths in Gunfree's categories, suicides plus homicides plus gun accidents.
In spite of what the loaded Gunfree statistics suggest, the risk of death in the US due to homicide, suicide and gun accidents is not significantly higher than in the rest of the world. We need improvement. We should be doing better. However, the lopsided statistics presented by Gunfree and others don't reflect the real risks.
Again, while gun control might cause murderers or potential suicides to switch weapons, it doesn't necessarily save lives. Certainly, not at the level that Bradley's and Gunfree's statistics attempt to suggest.
 |
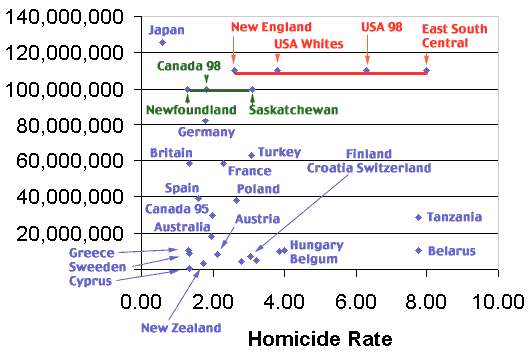
The above graphic displays homicide rate only. This is the important number. Suicides are not prevented by gun control. Gun accidents are few when compared to homicide. The rate for Caucasians in the US is clearly high, but not greatly so. The US homicide rate overall is very high. A good deal of our homicide problems are race related. Blacks in the US have a 23.0 rate per 100,000.
Most of the countries on Gunfree's chart are also above. Note, they are on the far left. While the Gunfree numbers are accurate, they are highly selective. Gunfree chose a list of countries that gave the emotional impression they desired. This is not to say that the US homicide rate is acceptable. It needs work. Looking at the USA homicide rates page, one can see that the work is being done. The table below shows the numbers used to generate the above chart. The table also includes a few countries with very high homicide rates. No, we shouldn't congratulate ourselves for being safer than Columbia or South Africa. However, to give the impression that we have a rate absurdly poorer than the rest of the world is false.
|
|
99 |
|
Population |
|
Hom |
Rate |
|
Japan |
126,182,077 |
96 |
125,428,003 |
0.20 |
752 |
0.60 |
|
Greece |
10,707,135 |
95 |
10,533,323 |
0.41 |
139 |
1.32 |
|
Sweden |
8,911,296 |
92 |
8,732,477 |
0.29 |
117 |
1.34 |
|
UK |
59,113,439 |
95 |
58,549,339 |
0.24 |
788 |
1.35 |
|
Cyprus |
754,064 |
96 |
739,108 |
0.67 |
10 |
1.35 |
|
Spain |
39,167,744 |
95 |
39,011,464 |
0.10 |
625 |
1.60 |
|
New Zealand |
3,662,265 |
94 |
3,486,245 |
0.99 |
60 |
1.72 |
|
Germany |
82,087,361 |
95 |
82,054,534 |
0.01 |
1,476 |
1.80 |
|
Australia |
18,783,551 |
96 |
18,285,389 |
0.90 |
359 |
1.96 |
|
Canada |
31,006,347 |
95 |
29,725,792 |
1.06 |
586 |
1.97 |
|
Austria |
8,139,299 |
95 |
8,110,063 |
0.09 |
172 |
2.12 |
|
France |
58,978,172 |
95 |
58,345,484 |
0.27 |
1,336 |
2.29 |
|
Poland |
38,608,929 |
95 |
37,846,307 |
0.50 |
1,005 |
2.66 |
|
Croatia |
4,676,865 |
96 |
4,662,862 |
0.10 |
130 |
2.79 |
|
Switzerland |
7,275,467 |
96 |
7,231,988 |
0.20 |
220 |
3.04 |
|
Turkey |
65,599,206 |
96 |
62,604,021 |
1.57 |
1,921 |
3.07 |
|
Finland |
5,158,372 |
94 |
5,119,858 |
0.15 |
165 |
3.22 |
|
Belgium |
10,182,034 |
95 |
10,157,634 |
0.06 |
392 |
3.86 |
|
Hungary |
10,186,372 |
95 |
10,268,272 |
-0.20 |
411 |
4.00 |
|
Tanzania |
31,270,820 |
95 |
28,731,338 |
2.14 |
2,229 |
7.76 |
|
Belarus |
10,401,784 |
96 |
10,429,919 |
-0.09 |
811 |
7.78 |
|
Philippines |
79,354,812 |
96 |
74,689,907 |
2.04 |
11,671 |
15.63 |
|
Brazil |
171,853,126 |
95 |
164,105,129 |
1.16 |
46,385 |
28.27 |
|
Columbia |
39,309,422 |
96 |
37,206,049 |
1.85 |
21,806 |
58.61 |
|
South Africa |
43,426,386 |
95 |
41,207,187 |
1.32 |
26,805 |
65.05 |
While I was able to get solid data for the United States and Canada from national web sites, the rest of the world's data was consolidated from two sites. The homicide rates came from a United Nations report. The report is several years old. The latest year reported varied from country to country, but was generally 1995, plus or minus one year. (The exception, Sweden, is 1992.) I attempted to duplicate the countries selected by Bradley, but also added additional countries. I tried to include one or two countries from all parts of the world, but with an emphasis on developed European countries. Many countries did not report to the UN, including Russia, China and India. I deliberately selected South Africa and Columbia for their racial and drug problems. I was mildly surprised to find Brazil well up there as well.
National population in 1999 and population growth in 1999 were taken from the CIA World Factbook. The corrected population is calculated from the 99 population, the number of years between 1999 and the last reported year, and the percentage population growth per year. This assumes a steady population growth. The final column is 100,000 time the number of homicides, divided by the adjusted population.
|
|
|
|
|
|
Canada |
1.82 |
USA |
6.3 |
|
Newfoundland |
1.29 |
New England |
2.6 |
|
Prince Edward Is. |
0.00 |
Mid Atlantic |
4.9 |
|
Nova Scotia |
2.55 |
East North Central |
5.9 |
|
New Brunswick |
0.66 |
West North Central |
3.4 |
|
Quebec |
1.87 |
South Atlantic |
7.3 |
|
Ontario |
1.35 |
East South Central |
8.0 |
|
Manitoba |
2.89 |
West South Central |
7.8 |
|
Saskatchewan |
3.11 |
Mountain |
6.6 |
|
Alberta |
2.16 |
Pacific |
5.8 |
|
British Columbia |
2.24 |
Whites |
3.8 |
|
Yukon |
9.8 |
Blacks |
23.0 |
|
Northwest Terr. |
12 |
Others |
2.9 |
Three of Canada's smaller provinces show unusual numbers. When the population of a province gets near or below 100,000, a very few homicides can radically change the number of homicides per 100,000. However, looking back at the 5 year trends, the 1998 homicide rates are indeed representative for these three provinces. In 1994 through 1998, Prince Edward Island had 1, 1, 1, 0 and 0 homicides respectively. Yes, showing PEI at 0.00 stands out, but they earned it. It wasn't a fluke. The Yukon, with 3, 4, 0, 1, 3 and Northwest Territories, with 4, 3, 4, 3, 5 are reasonably represented by their 1998 numbers. Still, clearly, with such a small population, the rate varies considerably from year to year.
The US Bureau of Justice numbers include break outs by race. Clearly, the 23.0 homicides among blacks is well out of the norm, doubling even the Northwest Territories.
 |
|
|
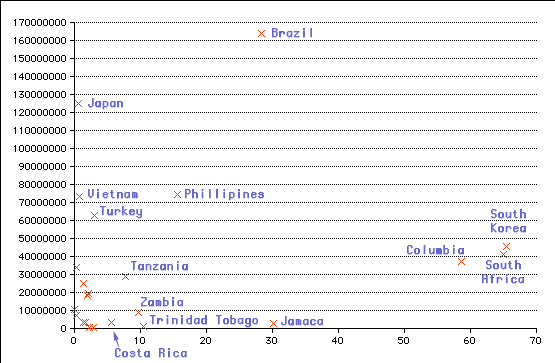
This is a second international comparison. I knew the gun control advocates are highly selective in comparing the US to countries with very low homicide rates. I didn't want to make the same mistake. While the first chart focuses on European nations, the above chart includes every country except those from Europe and North America that reported a homicide rate in the most complete and recent UN report.
I expected that third world countries would have more problems than Europe and North America. Certainly, I did find a good number of countries with high numbers. However, I was surprised by a large number of countries coming in under 3.0. On the Europe heavy chart, due to Hungary and Belgium coming in at 4.0, it is possible to argue that 4.0 and under is a solid passing grade. Here, the gap between 3 and 5 suggests that 3 might be considered passing. There are four countries between 5.0 and 11 that seem in a middle condition. We also have a half dozen that I'd put in the "serious problems" category.
This is still a selective survey. Far more countries failed to respond to the survey than responded. About half of those who did respond didn't fill in the homicide statistics. I wouldn't be surprised if the countries with higher homicide rates tended not to report. While the above is an honest effort to show the real level of violence in the world, my resources are limited.
|
Country |
Population 99 |
|
Corrected |
|
Raw |
|
|
Burkina Faso |
11,575,898 |
|
10,405,739 |
|
4 |
|
|
Argentina |
36,737,664 |
|
34,018,261 |
|
115 |
|
|
Guinea |
7,538,953 |
|
7,296,663 |
|
25 |
|
|
Japan |
126,182,077 |
|
125,177,648 |
|
752 |
|
|
Vietnam |
77,311,210 |
|
73,215,778 |
|
569 |
|
|
Peru |
26,624,582 |
|
25,140,663 |
|
337 |
|
|
New Zealand |
3,662,265 |
|
3,520,759 |
|
48 |
|
|
Singapore |
3,531,600 |
|
3,373,712 |
|
54 |
|
|
Australia |
18,783,551 |
|
18,285,389 |
|
359 |
|
|
Malaysia |
21,376,066 |
|
19,686,347 |
|
428 |
|
|
Fiji |
812,918 |
|
782,484 |
|
18 |
|
|
Brunei |
322,982 |
|
308,140 |
|
9 |
|
|
Turkey |
65,599,206 |
|
62,604,021 |
|
1,921 |
|
|
Costa Rica |
3,674,490 |
|
3,409,344 |
|
189 |
|
|
Tanzania |
31,270,820 |
|
28,731,338 |
|
2,229 |
|
|
Zambia |
9,663,535 |
|
8,885,724 |
|
868 |
|
|
Trinidad Tobago |
1,102,096 |
|
1,163,673 |
|
122 |
|
|
Philippines |
79,345,812 |
|
74,681,436 |
|
11,671 |
|
|
Brazil |
171,853,126 |
|
164,105,129 |
|
46,385 |
|
|
Jamaica |
2,652,443 |
|
2,585,613 |
|
780 |
|
|
Columbia |
39,309,422 |
|
37,206,049 |
|
21,806 |
|
|
South Africa |
43,426,386 |
|
41,207,187 |
|
26,805 |
|
|
S Korea |
46,884,800 |
|
45,505,925 |
|
29,790 |
|
Like the USA Homicide Rate argument preferred by the Second Amendment advocates, these numbers cannot be considered conclusive. It is clear from the numbers that the US is not doing as well as other countries. These numbers say nothing about why we are doing poorly. We have problems with race and drugs. These numbers do not begin to prove that we are doing poorly purely due to gun control policy. With but a few hundred data points, there is no way to control out other cultural factors.
 |
|
|
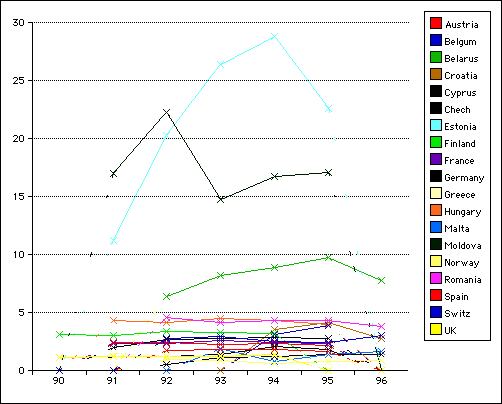
Here is one more chart based on the same UN Report. The prior table is based on all countries in the world except Europe and North America, the above chart is based on Europe only. This time, all numbers available between 1990 and 1996 are provided, not just the newest. A table of numbers used to generate the above are on the On Killing page.
Three countries are obviously high. These are Belarus, Estonia, and Moldova, all from the former Soviet Union. The non-Soviet countries stay nicely in an envelope between 0.5 and 5. The former Soviets are between 7 and 28. Again, New England is 2.6. Whites in the US are at 3.8. The US overall is at 6.3. Blacks in the US are at 23.
While this form of argument can't be considered conclusive, one can at least judge how honest Gunfree and others using the argument are. Pro gun control arguments based on international comparisons select the countries carefully, and never mention the race differential. If one is going to compare the United States against a dozen other countries, one can get any comparison one wishes depending on what countries one selects. The comparisons that show the US as worse than the rest of the world by a factor of ten are cooked. They are out right lies. We are not doing well. We should do better. However, we are in the envelope.
|
|
More Guns Less Crime - USA - World On Killing - White House Study - Children |